MONTH’S HIGHLIGHTS
- Inflation eased to 7.28% from 7.88% in June, marking the lowest rate increase since May 2022 and aligning with the Central Bank’s target range of 2.5%-7.5%. This decline was primarily driven by reduced pressure on food prices, with the food and non-alcoholic beverages index dropping from 10.3% to 8.6%. Additionally, the housing, water, electricity, gas and other fuels index decreased by 1.2% due to lower gas and electricity costs. However, the transport index rose by 3.5% from the previous month, mainly attributed to increased petrol and diesel prices, leading to higher transportation costs.
- Fitch Ratings revised Kenya’s long-term foreign-currency Issuer Default Rating (IDR) outlook from Stable to Negative while affirming the IDR at ‘B’. The change is due to increased external financing constraints resulting from high funding requirements, including a significant Eurobond maturity in 2024, as well as declining international reserves and rising financing costs. Uncertainty surrounding the fiscal trajectory and social unrest aggravated by potential risks in implementing announced tax hikes, have also contributed to the negative outlook. Despite these challenges, the rating acknowledges Kenya’s commitment to fiscal consolidation supported by the IMF program and its strong medium-term growth prospects. However, Kenya still faces issues related to relatively high government debt, external indebtedness and a narrow revenue base.
- IMF concluded its fifth review under the Extended Fund Facility and Extended Credit Facility Arrangements (EFF/ECF) for Kenya, resulting in an immediate disbursement of $415.4 million, including $110.3 million from access augmentation. The Board also agreed to extend EFF/ECF arrangement from 38 months to 48 months. In addition, the Executive Board has approved a $551.4 million 20-month arrangement under the Resilience and Sustainability Facility (RSF). This support aims to assist Kenya’s pioneering initiatives in developing climate resilience and enhancing private climate financing. To complement these measures and establish a cautious and mutually reinforcing policy framework, the program also emphasizes a proactive monetary policy approach.
- The Central Bank of Kenya launched the DhowCSD, a new digital trading platform that allows investors in Kenya and the diaspora to participate in government securities in a simple, efficient and secure way. This platform includes services such as the Central Security Depository, which allows users to open accounts and bid for government securities.
- According to the IMF’s World Economic Outlook (WEO) July report, global growth is expected to decline from an estimated 3.5% in 2022 to 3.0% in both 2023 and 2024. Despite being marginally higher than the previous April 2023 WEO prediction, the forecast for 2023 remains historically low. The hike in central bank policy rates to combat inflation is still weighing on economic growth. Global headline inflation is expected to fall from 8.7% in 2022 to 6.8% in 2023, then to 5.2% in 2024. However, core inflation is expected to drop more gradually while inflation predictions for 2024 have been revised upward.
- The US Federal Reserve raised the federal funds rate target range by 25 bps to 5.25%-5.5% in July 2023, meeting market expectations and raising borrowing costs to their highest level since January 2001. Policymakers reaffirmed their commitment to closely monitor incoming economic data and adjust monetary policy as needed to meet inflation and employment targets. The decision to resume the tightening stance came after a pause in June, noting that the economy showed moderate expansion, robust job gains and a low unemployment rate, despite elevated inflation.
- The European Central Bank (ECB) raised interest rates by 25 bps, marking the ninth consecutive rate hike. The decision was made due to concerns about persistently high inflation despite recent slowdowns. The main refinancing operations rate currently stands at 4.25%, the highest since October 2008 and the deposit facility rate reached a 22-year high of 3.75%. The ECB has committed to a “data-dependent approach” for future rate decisions and plans to maintain appropriately restrictive levels until inflation returns to its 2% target. Since July 2022, the ECB has implemented an unprecedented 425 bps increase in rates, the fastest tightening pace in its history.
ECONOMIC INDICATORS
Foreign Exchange Reserves
During the month, the usable foreign reserves decreased by 1.32% to settle at USD 7.38 billion (4.03 months of import cover). This meets CBK’s statutory requirement to endeavour to maintain at least 4 months of import cover. However, it still falls short of the EAC region’s convergence criteria of 4.5 months of import cover.
Currency
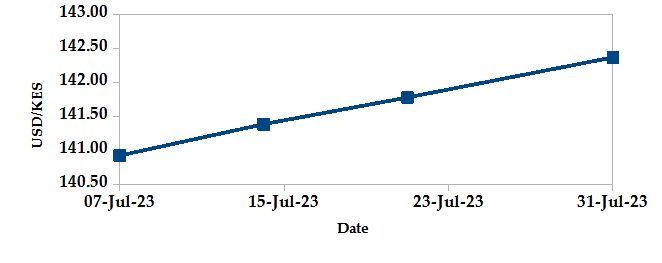
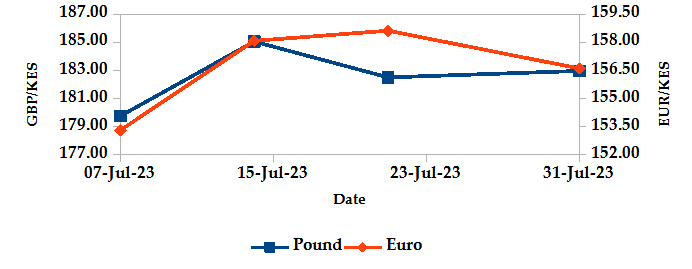
The Kenyan Shilling depreciated against the USD, the Sterling Pound and the Euro by 1.31%, 3.21% and 2.37%, exchanging at Kshs 142.36, Kshs 182.97 and 156.61 at the end of the month, up from Kshs 140.52, Kshs 177.28 and 152.98 in the previous month. The depreciation against the Dollar is a result of rising demand from importers and investors mitigating their risk by holding foreign currency deposits.
USD Vs KSHS
STERLING POUND & EURO Vs KSHS
Inflation
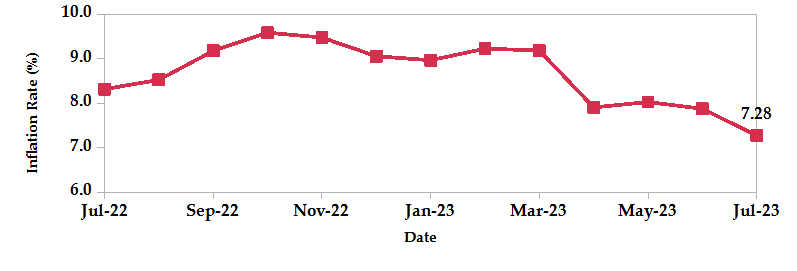
The overall year-on-year inflation declined to 7.28% in July from 7.88% in June. This is mainly attributed to lower food, gas and electricity prices.
INFLATION EVOLUTION
Liquidity
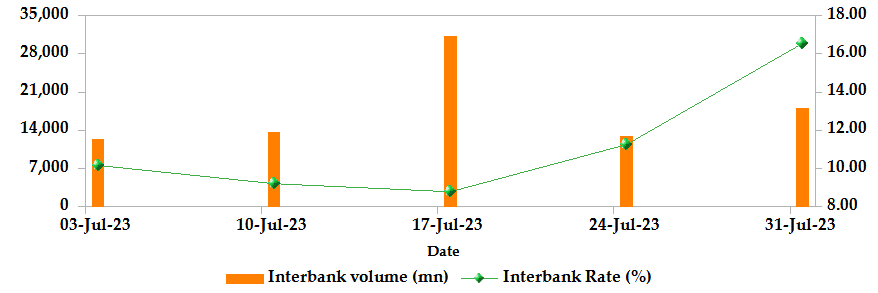
During the month, liquidity tightened as a result of tax remittances which more than offset government payments. The interbank rate increased to 16.55% from 10.17%. The volume of inter-bank transactions decreased to Kshs 18.08 billion from Kshs 38.54 billion. Commercial banks’ excess reserves decreased from Kshs 59.30 billion to Kshs 18.10 billion.
INTER-BANK RATE and VOLUME
FIXED INCOME
T-Bills
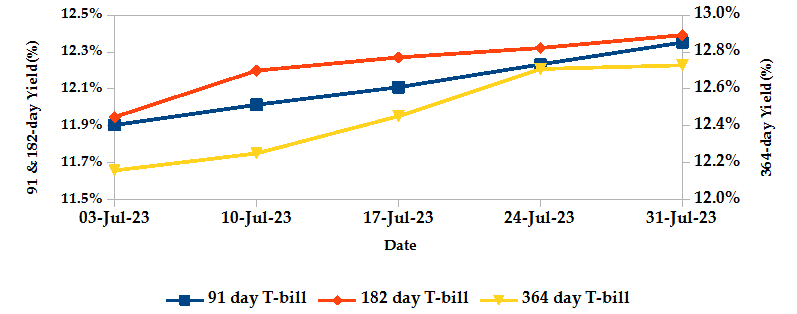
T-bills recorded an overall subscription rate of 119.98% during the month of July, compared to 86.76% recorded in the previous month. The performance of the 91-day, 182-day and 364-day papers stood at 597.30%, 31.23% and 17.81% respectively. On a monthly basis, yields on the 91-day, 182-day and 364-day papers increased by 3.76%, 3.72% and 4.70% to 12.35%, 12.39% and 12.73% respectively as investors aggressively bid to compensate for a weaker Shilling and inflationary pressures.
T-BILLS
T-Bonds
During the month, T-Bonds registered a total turnover of Kshs 58.41 billion from 2,516 bond deals. This represents a monthly increase of 17.17% and a decrease of 10.17% respectively. The yields on government securities in the secondary market increased during the month of July.
In the primary market, CBK issued a new FXD1/2023/5 bond and reopened FXD1/2016/10 with an effective tenor of 3.2 years, seeking Kshs 40.0 billion from both papers. Additionally, the Central Bank reopened the same FXD1/2023/5 and FXD1/2016/10 through a tap sale seeking to raise 20.0 billion with coupon rates of 16.84% and 15.04% respectively.
In the international market, yields on Kenya’s Eurobonds marginally increased by an average of 6 basis points.
YIELD CURVE

EQUITIES
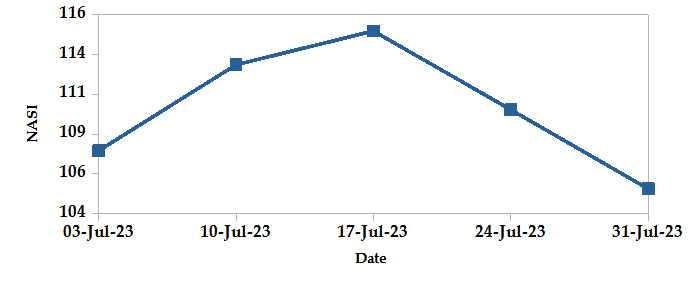
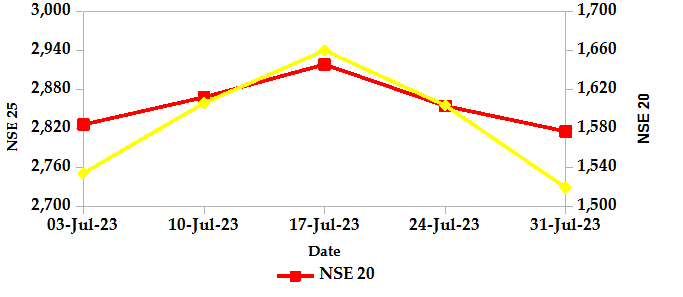
During the month, market capitalization lost 1.42% to settle at Kshs 1.64 trillion. Total shares traded increased by 59.18% to 412.62 million shares and equity turnover went up 36.08% to close at Kshs 6.56 billion. On a monthly basis, NASI settled 1.41% lower while NSE 20 and NSE 25 settled 0.15% and 0.01% higher. The performance was a result of losses recorded by large-cap stocks such as EABL, Safaricom and KCB of 9.03%, 3.43% and 2.73%. These were however mitigated by gains recorded by other large-cap stocks such as Stanbic, Equity and ABSA of 7.87%, 7.19% and 4.66% respectively.
NASI
NSE 20 and NSE 25
ALTERNATIVE INVESTMENTS
- The derivatives market, over the month, recorded 67 contracts with a turnover of Kshs 4.19 million which was a decrease from 78 contracts with a turnover of Kshs 10.14 million recorded in the previous month.
- I-REIT market, over the month, recorded a turnover of Kshs 2.14 million with 198 deals which was an increase from Kshs 1.20 million with 198 deals recorded in the previous month.
- The ETF market, over the month, remained inactive.
GLOBAL AND REGIONAL MARKETS
| Global Markets | Weekly Change | Monthly Change |
|---|---|---|
| S&P 500 | 3.11% | 20.00% |
| STOXX Europe 600 | 2.04% | 8.56% |
| Shanghai Composite (SSEC) | 3.19% | 5.60% |
| MSCI Emerging Market Index | 5.80% | 8.76% |
| MSCI World | 3.29% | 17.82% |
| Regional Markets | Weekly Change | Monthly Change |
|---|---|---|
| FTSE ASEA Pan African Index | 1.76% | -3.20% |
| JSE All Share | 4.14% | 7.71% |
| NSE All Share (NGSE) | 5.53% | 24.70% |
| DSEI (Tanzania) | -0.99% | -5.67% |
| ALSIUG (Uganda) | -0.89% | -17.00% |
- Global markets posted gains during the month. In the US, both the S&P 500 and the Dow Jones index rose 3.11% and 3.35%, respectively, owing to the Federal Reserve adjusting its forecast to avoid a recession this year, as well as easing inflationary pressures and a drop in the unemployment rate. In Europe, both the STOXX Europe 600 and the UK’s FTSE 100 indices went up by 2.04% and 2.23%, respectively, following a decline in Eurozone inflation in July. In Asia Pacific, the Shanghai Composite (SSEC) index increased by 3.19%, as Chinese stimulus measures spurred investors to take advantage of discounted markets despite the country’s continued downturn in business activity in July.
- On a regional front, markets posted mixed performance. The FTSE ASEA Pan African index, representing the overall African markets gained 1.76% from June. South Africa’s JSE All Share and Nigeria’s All Share index rose 4.14% and 5.53% while Tanzania’s DSEI and Uganda’s All Share index lost 0.99% and 0.89% respectively.
- On the global commodities markets, oil future indices edged higher as Saudi Arabia and Russia, the world’s two largest oil producers, announced their plans to impose additional production cutbacks starting in August, resulting in further tightening of global supply. Crude Oil WTI futures and ICE Brent Crude Oil settled 15.80% and 14.06% higher to close at $81.80 and $85.43 respectively.
Get future reports
Please provide your details below to get future reports: