FOCUS OF THE MONTH: OUTLOOK ON OFFSHORE INVESTMENTS
Investing in offshore assets offers the possibility of greater returns for pension funds than those offered in domestic markets in certain conditions. They constitute global equities, bonds, commodities and derivatives. It provides benefits of diversification, liquidity and non-correlation to domestic markets. The biggest drawback is exposure to global economic movements which makes investments susceptible to economic downturns during financial crises.
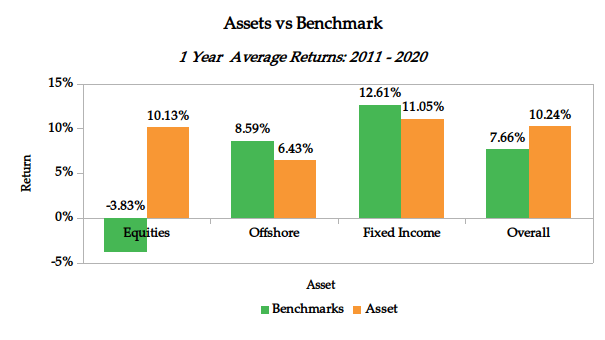
Based on our pension performance survey, offshore and fixed income asset classes had the highest return compared to equities and the overall asset class as indicated by the graph.
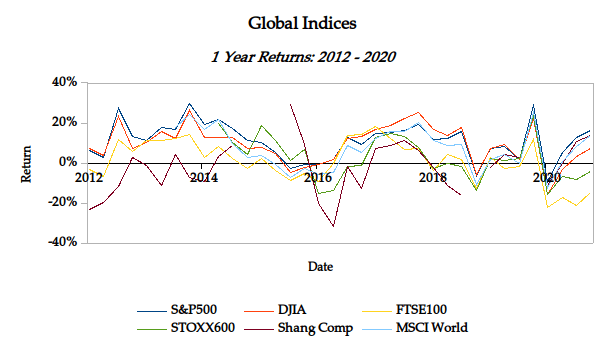
The major global market indices performance in 2020 were characterized by S&P 500. Dow Jones Industrial Average, FTSE 100, STOXX 600, Shanghai Composite and MSCI world declining by 43.70%, 67.56%, 218.52%, 117.46%, 37.83% and 44.19% respectively. This was due to the combined effect of Brexit and the Covid-19 pandemic on the global economy. The trend of offshore benchmarks over the last 10 years demonstrates this (see graph below).
Factors Affecting Offshore Asset Class
There are various factors that affect the performance of offshore asset class returns. Key among them in the recent past have been:
- Brexit resulted in the introduction of new regulations for market participants in the UK resulting in limited access to the EU market and funding from the EU investors. The FTSE 100 index declined by 15% in the year 2020 due to the impact of the Brexit-induced friction in markets.
- The US election positively impacted markets due to a reduction in trade tensions with China. Over the year 2020, the S&P 500 and DJIA indices gained by 16.26% and 7.25%. Strong stimulus measures have supported a robust recovery in consumer spending.
- The COVID-19 pandemic resulted in extreme market volatility followed by unprecedented levels of monetary and fiscal responses by central banks and governments respectively for most countries. The COVID-19 vaccine announcements greatly supported capital markets and the bond markets as well.
ECONOMIC INDICATORS
Foreign Exchange Reserves
During the month, the CBK’s usable foreign reserves declined by 3.43% to stand at USD 7.34 billion(4.51 months of import cover). Thus the CBK may struggle to support the shilling in the event it depreciates in value. However, this meets the CBK’s statutory requirement to endeavour to maintain at least 4 months of import cover, and the EAC region’s convergence criteria of 4.5 months of import cover.
Currency
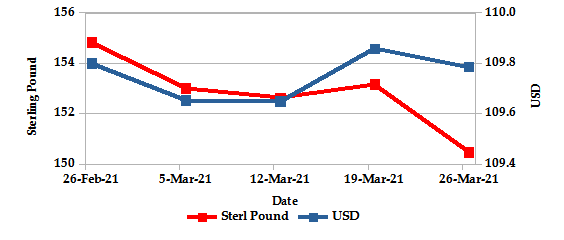
The Kenyan Shilling gained against the USD by 0.01% exchanging at Kshs 109.79 at the end of the month down from Kshs 109.80 in the previous month. The appreciation is due to optimism over the economic recovery from the Covid-19 pandemic and the decline in the current account deficit as a percentage of GDP. The Shilling is expected to remain stable supported by increased exports due to increased global demand for Kenyan exports and reduced risk of losses due to crop damage from locusts. Foreign remittance inflows are likely to increase due to the recent IMF loan that was approved.
USD & STERLING POUND Vs KSHS
Inflation
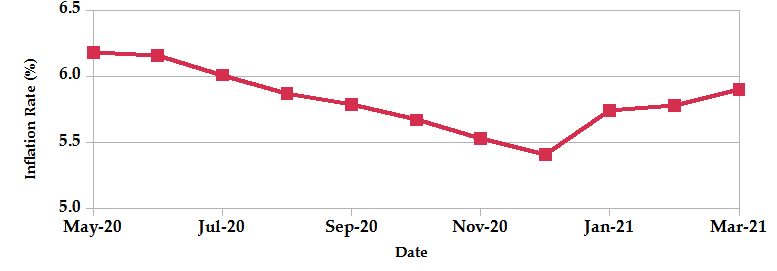
The overall year-on-year inflation increased to 5.90% in the month of March up from a revised figure of 5.78% in February. The increase is attributable to the 0.4% increase in the Food and Non-Alcoholic Drink’s Index due to increases in prices of fruits and vegetables, 0.6% increase in Housing, Water, Electricity, Gas and Other Fuels’ Index due to increase in the price of kerosene and electricity and a 1.5% increase in the Transport Index driven by an increase in the prices of diesel and petrol. The increase in global fuel prices is likely to keep inflation rates high.
INFLATION EVOLUTION
Liquidity
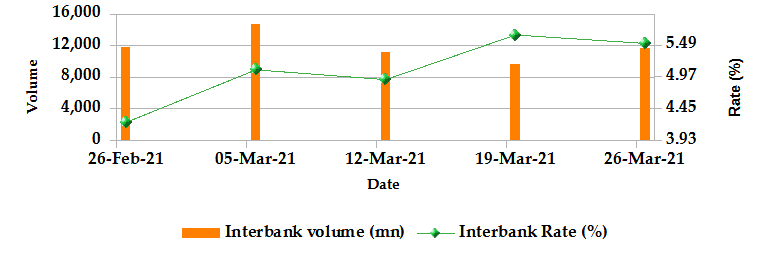
During the month of March, liquidity increased as a result of government payments. The inter-bank rate marginally increased to 5.53% from 4.23% in February. The volume of inter-bank transactions increased from Kshs 11.7 billion to Kshs 12.0 billion. Commercial banks excess reserves increased to Kshs 15.3 billion from 12.5 billion in February.
The CBK lowered commercial banks’ reserve ratio to inject liquidity into the market. This helped increase the interbank volume.
INTER-BANK RATE and VOLUME
FIXED INCOME
T-Bills
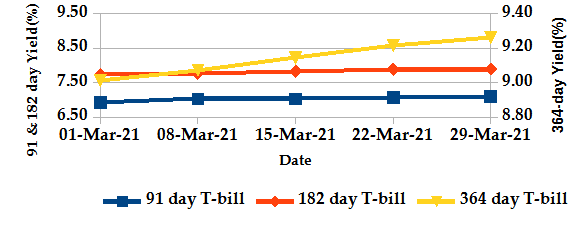
The T-bills recorded an overall subscription rate of 117.14% at the end of the month of March, compared to 94.70% recorded in the previous month. The increase in subscriptions is due to an increase in market liquidity from government payments which partly offset tax receipts. The performance of the 91-day, 182-day and 364-day papers stand at 129.49%, 76.09% and 153.24% respectively. On a monthly basis, the yields on the 91-day, 182-day and 364-day papers increased by 2.25%, 2.18% and 2.72% respectively to 7.09%, 7.89% and 9.26%.
T-BILLS
T-Bonds
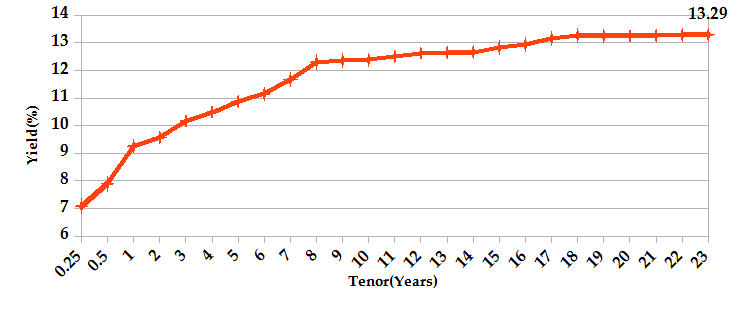
Over the month of March, the T-Bonds registered a total turnover of Kshs 54.83 billion from 1,433 bond deals. This represents a monthly decrease of 32.53% and 26.02% respectively. The yields on government securities in the secondary market remained relatively stable during the month of March.
In the international market, yields on Kenya’s Eurobonds increased marginally to 5.10% from 4.98%.
YIELD CURVE
EQUITIES
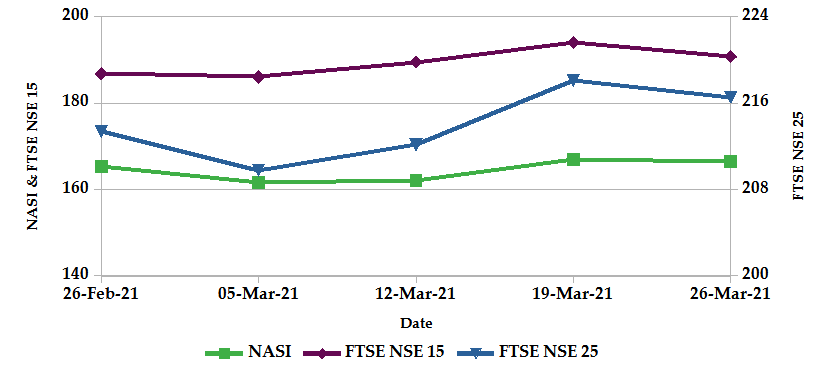
- During the month of March, NASI, NSE 20 and NSE 25 decreased by 0.2%, 1.6% and 1.2% respectively on a monthly basis.
- At the close of the month, market capitalization increased by 0.66% to Kshs 2.56 trillion. Total shares traded and equity turnover decreased by 2.2% and 11.8% respectively to 10 million shares and Kshs 0.31 billion.
- On a weekly basis, the NASI and NSE 25 increased by 0.7% and 1.2% while the NSE 20 declined by 0.7%. The increase in NASI is a result of gains of large-cap stocks such as Equity Group Holdings Plc, Standard Chartered Bank Kenya, KCB Group Plc and Co-operative Bank Kenya Plc.
- Stocks listed in the NSE lost Sh 80.02 billion of their value as foreign investors sold off shares in a single day. This was one of the largest drops in the history of the bourse.
NASI, FTSE NSE 15 and FTSE NSE 25
ALTERNATIVE INVESTMENTS
- The derivatives market over the month recorded 105 contracts having a turnover of Kshs 22.79 million which was an increase from 73 contracts having a turnover of Kshs 13.94 million recorded over the last month.
- The I-REIT market over the month recorded 176 contracts having a turnover of Kshs 2.54 million which was a decrease from 142 contracts having a turnover of Kshs 3.01 million recorded over the last month.
- The ETF market registered no activity.
GLOBAL AND REGIONAL MARKETS
| Global Markets | Weekly Change | Monthly Change |
|---|---|---|
| S&P 500 | 1.57% | 4.29% |
| STOXX Europe 600 | 0.85% | 5.42% |
| Shanghai Composite (SSEC) | 0.40% | -2.59% |
| MSCI Emerging Market Index | -2.20% | -2.37% |
| MSCI World Index | 0.67% | 3.23% |
| Regional Markets | Weekly Change | Monthly Change |
|---|---|---|
| FTSE ASEA Pan African Index | 1.01% | -0.99% |
| JSE All Share | 1.54% | 0.81% |
| NSE All Share (NGSE) | 2.17% | -1.47% |
| DSEI (Tanzania) | 0.11% | 1.72% |
| ALSIUG (Uganda) | -0.19% | 5.51% |
- During the month, US Stocks gained as investors bet on a recovery that is expected to deliver the fastest economic growth since 1984. The S&P 500 and Dow Jones indices gained by 4.29% and 6.92% respectively from the previous month. In Europe, the continental index of STOXX Europe 600 and UK’s FTSE 100 gained by 5.42% and 3.97% respectively.
- On a regional front, most markets had mixed returns. The FTSE ASEA Pan African index, representing the overall African markets, declined by 0.99% from the month of February. South Africa’s JSE All Share increased by 0.81%, Uganda’s All Share Index gained by 5.51% and Tanzania’s DSEI increased by 1.72%. However, Nigeria’s All-share index declined by 1.47%.
- On the global commodities markets, the crude prices largely bounced back from a plunge due to concerns that a container ship that ran aground may block the vital Suez Canal shipping lane for weeks, resulting in lower supply. The Crude Oil WTI futures decreased by 0.28% from the previous month of February. Also, the ICE Brent Crude Oil plunged by 2.36%.
Month’s Highlights
Fitch affirmed Kenya’s Long-Term Foreign-Currency (LTFC) Issuer Default Rating (IDR) at B+ with a negative outlook. This was due to a track record of strong growth and relative macroeconomic stability. The government increased its domestic debt issuance for the fiscal year 2021 while interest rates remained stable.
Get future reports
Please provide your details below to get future reports: