MONTH’S HIGHLIGHTS
- Inflation saw a slight uptick to 6.78% in September from 6.72% in August, marking its first increase since May but still within the central bank’s target range of 2.5% to 7.5%. The increase was primarily driven by higher food and fuel prices. The food and non-alcoholic beverages index went up 0.7%, attributed to elevated food prices. Despite a decline in electricity prices, the housing, water, electricity, gas and other fuels index surged 1.4%, mainly due to an increase in kerosene prices. Furthermore, the transport index went up 3.5% from the previous month, as a result of heightened petrol and diesel prices.
- The Central Bank of Kenya (CBK) launched the DhowCSD, a digital trading platform that streamlines local and foreign investor participation in government securities. The platform offers world-class registry, custodial, and settlement services for both primary and secondary market operations. It is designed to transform Kenya’s financial markets by making them more efficient, transparent and accessible which will enhance participation in the Kenyan capital market.
- The Nairobi Securities Exchange (NSE) launched two new market indices: the NSE 10 Share Index (N10) and the NSE Bond Index (NSE-BI). The N10 Index tracks the performance of the top 10 most traded companies on the NSE, while the NSE-BI tracks the performance of the benchmark government bonds listed on the NSE. The N10 Index is based on a market capitalization-float-adjusted methodology. While the NSE-BI is a weekly index that is based on the closing prices of the benchmark government bonds on the NSE, the index is expected to be used as the underlying asset for a fixed-rate futures contract that will be issued on the NSE derivatives market.
- The Capital Markets Authority (CMA) approved Kenya’s first-ever Sukuk bond issuance, a Shari’ah-compliant financial instrument. The Linzi Sukuk, issued by Linzi Finco Trust, offers a return of 11.13% and seeks to raise Ksh 3 billion. The funds will be used to develop 3,069 institutional housing units, aligning with the government’s Transformative Agenda to address the rising demand for affordable housing. The CMA’s approval signifies a notable diversification of the capital markets, offering investors an ethical and socially responsible investment option.
- The US economy grew at a 2.1% annual rate in the second quarter of 2023, unchanged from the prior estimate. This is down from the 2.2% growth in the first quarter. Consumer spending increased far less than anticipated, but non-residential fixed investment, exports and residential investment all had positive revisions. Government spending increased, in line with prior projections. The Fed expects the economy to grow at a 2.1% annual rate in 2023.
- Eurozone inflation eased to 4.3% in September 2023, its lowest level since October 2021 and below market expectations of 4.5%. Prices for services, non-energy industrial goods and food, alcohol & tobacco rose at a slower pace, while the decline in energy prices accelerated. Core inflation also declined to 4.5%, its lowest level since August 2022. Inflation rates decreased in Germany, France, and the Netherlands in September but accelerated in Italy and Spain.
- UK’s economy grew by 0.2% in the second quarter of 2023, unchanged from the previous estimate. This is down from a 0.3% growth in the first quarter. Household consumption was the main driver of growth, rising by 0.5% attributed to spending on transportation, housing, water, power, gas, recreation and culture. Additionally, business investment increased by 4.1%, while government spending rose by 2.5%. However, the 0.9% decline in exports and 2.2% increase in imports led to a negative contribution from net trade.
- The Caixin China General Composite PMI declined to 50.9 in September 2023, down from 51.7 in August, the slowest growth in private sector activity since January. New orders and sales rose at a slower pace, with manufacturers and service providers reporting only marginal increases in sales. However, employment remained unchanged. Additionally, input prices rose at the fastest pace in six months and selling prices at the fastest pace in 18 months, driven by a new hike in factory gate prices and service sector charges.
ECONOMIC INDICATORS
Foreign Exchange Reserves
During the month, the usable foreign reserves declined by 1.99% to settle at USD 6.94 billion (3.80 months of import cover). This falls short of CBK’s statutory requirement to endeavour to maintain at least 4 months of import cover as well as the EAC region’s convergence criteria of 4.5 months of import cover.
Currency
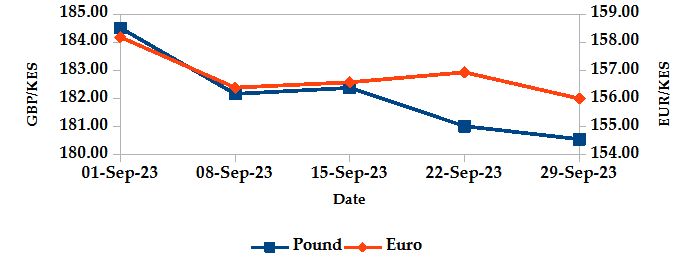
The Kenyan Shilling depreciated against the USD by 1.85%, but appreciated the Sterling Pound and the Euro by 2.21% and 1.69%, exchanging at Kshs 148.10, Kshs 180.56 and Kshs 156.00 respectively at the end of the month, from Kshs 145.41, Kshs 184.64 and Kshs 158.69 in the previous month. The depreciation against the Dollar is a result of rising demand from importers and investors mitigating risks by holding foreign currency deposits.
USD Vs KSHS

STERLING POUND & EURO Vs KSHS
Inflation
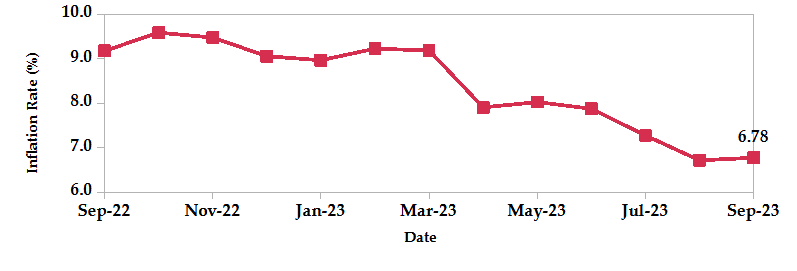
The overall year-on-year inflation increased to 6.78% in September from 6.72% in August. This is mainly attributed to higher food and fuel prices.
INFLATION EVOLUTION
Liquidity
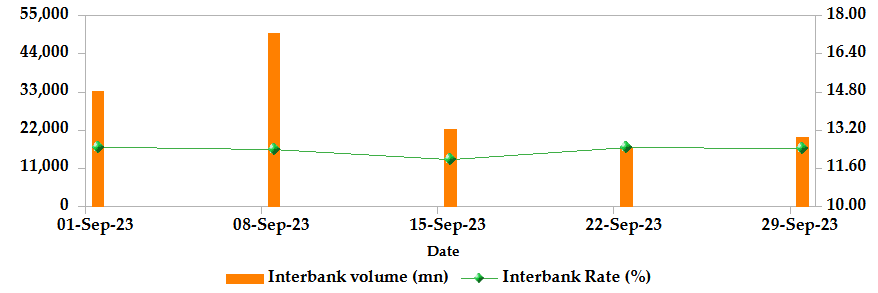
During the month, liquidity tightened as a result of tax remittances which more than offset government payments. The interbank rate increased from 12.40% to 12.44%. The volume of inter-bank transactions decreased from Kshs 31.91 billion to Kshs 20.00 billion. Commercial banks’ excess reserves increased from Kshs 14.90 billion to Kshs 19.30 billion.
INTER-BANK RATE and VOLUME
FIXED INCOME
T-Bills
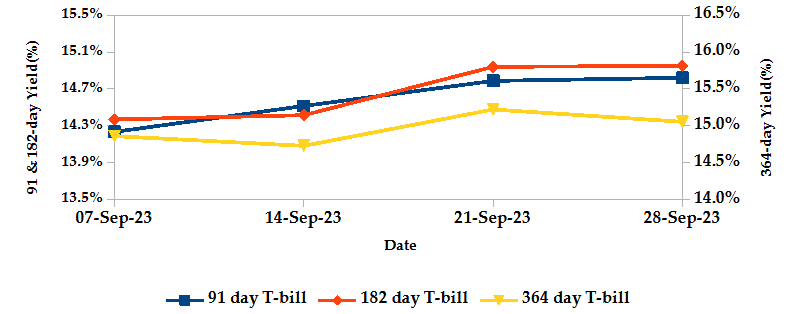
T-bills recorded an overall subscription rate of 98.73% during the month of September, compared to 125.07% recorded in the previous month. The performance of the 91-day, 182-day and 364-day papers stood at 499.42%, 10.79% and 26.39% respectively. On a monthly basis, yields on the 91-day, 182-day and 364-day papers increased by 5.98%, 7.25% and 9.36% to 14.82%, 14.95% and 15.05% respectively as investors aggressively bid to compensate for a weaker Shilling and inflationary pressures.
T-BILLS
T-Bonds
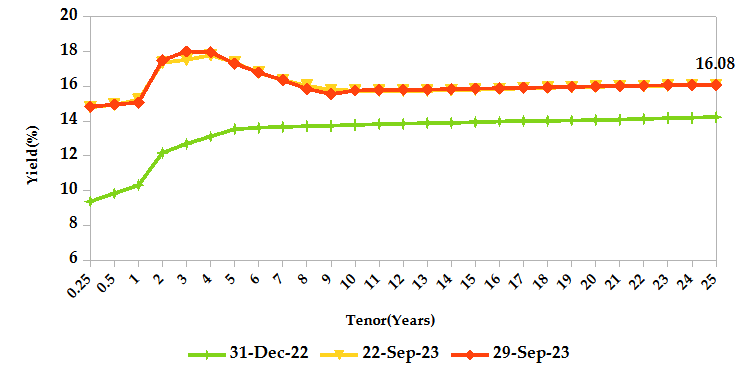
During the month, T-Bonds registered a total turnover of Kshs 94.27 billion from 2,214 bond deals. This represents a monthly increase of 68.72% and a decrease in bond deals of 6.21%. The yields on government securities in the secondary market increased during the month of September.
In the primary bond market, CBK reopened FXD1/2023/002 and FXD1/2016/010 twice which sought to raise Kshs 50.0 billion. Bids were accepted at a weighted average rate of 17.45% and 17.93% respectively.
In the international market, yields on Kenya’s Eurobonds increased by an average of 193 basis points.
YIELD CURVE
EQUITIES
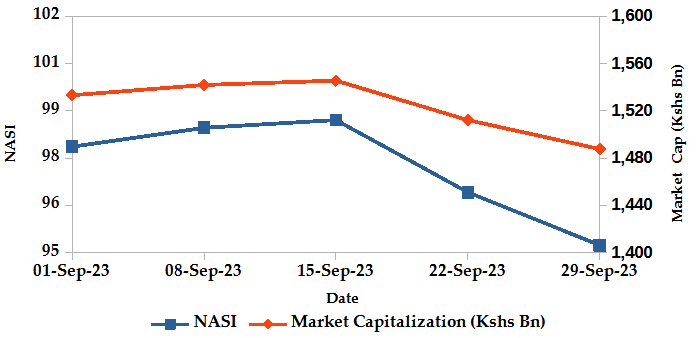
During the month, market capitalization lost 3.71% to settle at Kshs 1.49 trillion. Total shares traded decreased by 42% to 236.29 million shares and equity turnover dropped 23.95% to close at Kshs 4.08 billion. On a monthly basis, NASI, NSE 20 NSE 25 and NSE 10 settled 4.04%, 2.04%, 4.07 and 4.04% lower. The performance was a result of losses recorded by large-cap stocks such as KCB, Equity and Safaricom of 11.65%, 8.49% and 5.19%, these were however mitigated by the gains recorded by other large-cap stocks such as Standard Chartered and ABSA of 3.61% and 2.14%.
NASI and Market Capitalization
NSE 20 and NSE 25

ALTERNATIVE INVESTMENTS
- The derivatives market, over the month, recorded 116 contracts with a turnover of Kshs 6.99 million, which was a decrease from 141 contracts with an increase in turnover of Kshs 5.00 million recorded in the previous month.
- I-REIT market, over the month, recorded a turnover of Kshs 1.98 million with 168 deals which was a decrease from Kshs 216.14 million with 680 deals recorded in the previous month.
- The ETF market, over the month, recorded a turnover of Kshs 3.85 million with 3 deals which was an increase from Kshs 3.5 million with 1 deal recorded in the previous month.
GLOBAL AND REGIONAL MARKETS
| Global Markets | Weekly Change | Monthly Change |
|---|---|---|
| S&P 500 | -4.87% | 12.13% |
| STOXX Europe 600 | -1.74% | 3.69% |
| Shanghai Composite (SSEC) | -0.30% | -0.19% |
| MSCI Emerging Market Index | -2.81% | -1.02% |
| MSCI World | -4.45% | 9.70% |
| Regional Markets | Weekly Change | Monthly Change |
|---|---|---|
| FTSE ASEA Pan African Index | -0.56% | -4.25% |
| JSE All Share | -4.01% | 2.72% |
| NSE All Share (NGSE) | -0.25% | 28.66% |
| DSEI (Tanzania) | 0.42% | -5.64% |
| ALSIUG (Uganda) | -1.71% | -22.71% |
- Global markets generally registered losses during the month. In the US, the S&P 500 lost 4.87% and the Dow Jones index lost 3.49%, as investors weighed the implications of a US inflation report for the Federal Reserve’s interest rate policy and adjusted their portfolios accordingly. In Europe, the STOXX Europe 600 edged 1.74% lower while the UK’s FTSE 100 indices edged 2.27% higher, following a drop in eurozone inflation and hopes that the European Central Bank (ECB) will pause its interest rate hikes. In Asia Pacific, the Shanghai Composite (SSEC) index lost 0.30%, mainly attributed to rising bond yields and concerns about slowing Chinese economic growth.
- On a regional front, markets recorded mixed performance. The FTSE ASEA Pan African index, representing the overall African markets lost 0.56% from August. South Africa’s JSE All Share Index, Nigeria’s All Share Index and Uganda’s All Share Index dropped by 4.01%, 0.25% and 1.71% respectively, while Tanzania’s DSEI rose by 0.42%.
- On the global commodities markets, oil future indices edged higher, primarily driven by the anticipation of tighter supplies, resulting from deeper production cuts by Saudi and Russia, which largely offset outweighed concerns over slowing economic growth. Crude Oil WTI futures and ICE Brent Crude Oil settled 8.56% and 6.15% higher to close at $90.79 and $92.20 respectively.
Get future reports
Please provide your details below to get future reports: